How Do You Calculate Tieback Loads for Anchored Steel Sheet Pile Systems?
An underestimated tieback load can pull a finished wall forward. I have seen repairs that cost far more than the original anchors, so this calculation deserves your full attention.
Tieback load is the axial force each ground anchor must carry to hold an anchored steel sheet pile wall against lateral earth pressure, water pressure, and surcharge. You calculate it from the active pressure behind the wall, subtract the passive resistance at the toe, multiply by the anchor spacing, and divide by the cosine of the anchor angle.

Anchored walls let you build taller excavations with lighter sections. That is exactly why I like them for port and river projects. But the anchor only works if the load behind it is honest. In this guide I walk you through the forces, the calculation, the spacing logic, and the tests I ask for before my customers excavate.
What Is a Tieback Load in an Anchored Steel Sheet Pile System?
Many buyers treat the anchor as a simple bolt. It is not. The tieback load is the working force that travels through the whole wall system.
A tieback load is the axial force an anchor transfers from the sheet pile wall into stable soil behind the active zone. It collects every lateral push on the wall and delivers it to a fixed bond length, so the wall stays in position during and after excavation.
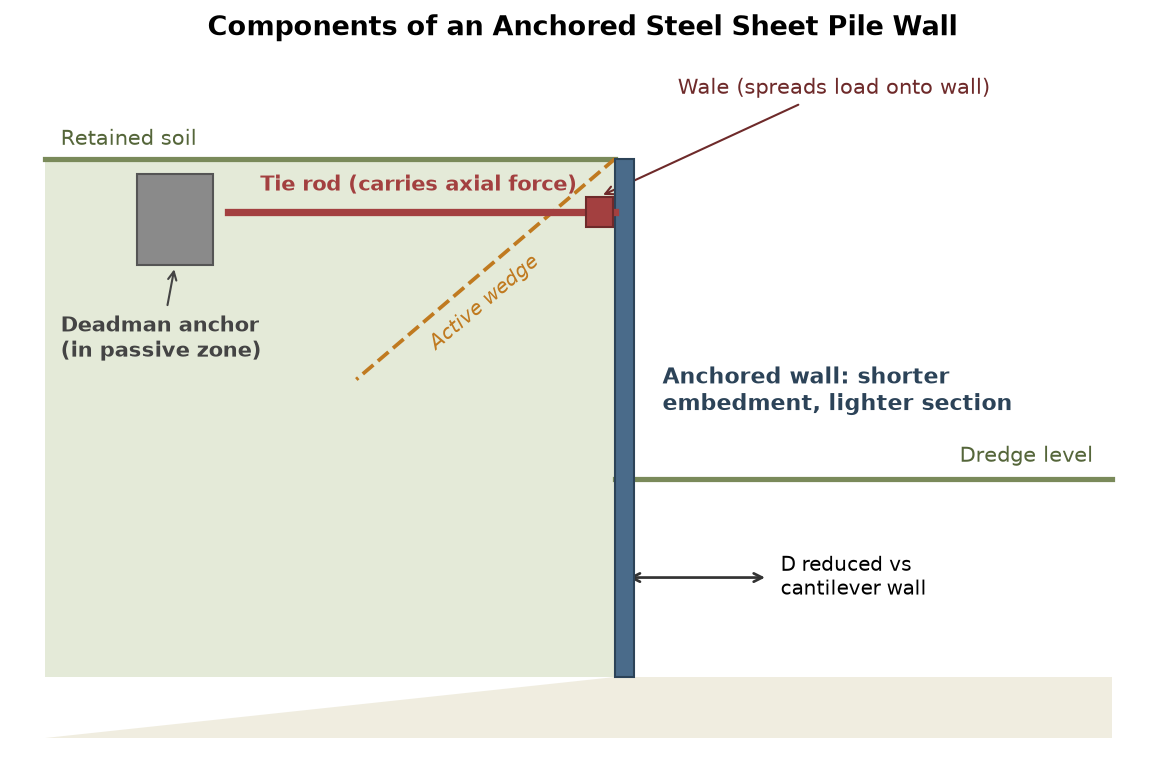
The load path from soil to bond zone
The force starts as lateral earth pressure on the wall facing. The steel sheet pile wall collects this pressure and passes it to a wale at the anchor level. The wale spreads the force along the wall so no single pile is overloaded. From the wale, the force enters the tie rod or anchor tendon. The tendon carries it at an angle, usually between 15 and 30 degrees below horizontal, into the grouted bond zone. Inside the bond zone, the load transfers to the soil through skin friction. Only the part of the drilled length behind the potential failure wedge counts as fixed. The free length must stay unbonded so the anchor can stretch and work.
I always remind my customers that every link in this chain has a design role. A weak wale or a short bond zone will limit the wall even if the sheet piles themselves are strong. When you source components separately, check that the rated capacities match your calculated loads. For a broader view of how these walls behave, see the design principles of steel sheet pile retaining structures on our blog.
| Component | Role in the load path | Typical failure mode if undersized |
|---|---|---|
| Sheet pile wall | Collects lateral pressure and spans between anchor levels | Excessive deflection or local buckling |
| Wale | Spreads anchor force across several piles | Wale bending, flange warping |
| Tie rod / tendon | Carries the axial force at the anchor angle | Rod stretch, thread slip, fatigue |
| Anchor head | Locks the tendon to the wale | Nut stripping, bearing failure |
| Bond zone | Transfers force into stable soil by friction | Pullout before design load |
Which Forces Create the Tieback Load Behind the Wall?
If you only count soil weight, your anchor will be undersized. Several forces stack up behind the wall, and each one changes the number.
The tieback load is created mainly by active earth pressure from the retained soil. Water pressure, surface surcharges, and construction loads add on top of it. In most of my projects, water and surcharge together can add 20 to 40 percent to the basic soil load.
Water pressure changes everything
Active soil pressure follows classic earth pressure theory, and you can read the basics in our guide to active and passive earth pressure. But water ignores soil mechanics. Where the water table is high, hydrostatic pressure acts on the full wetted height of the wall. Sudden drawdown after a rainstorm can trap water behind the wall while the front side is already dewatered. That unbalanced pressure is often the peak load case for the anchor. I saw this on a river project in Southeast Asia, where a week of rain raised the anchor load on a U-type wall well above the summer design value. The wall survived because the designer had checked the flood case. My rule is simple: calculate the tieback load for at least two water levels, normal and flood, and size the anchors for the worse one.
Surcharge loads are quieter but just as real. Stacked pallets, crawler cranes, and temporary roads near the crest all push the wall forward. Keep heavy plant at least one wall height away from the crest, or include its pressure in the calculation.
| Load source | Typical share of total tieback load | How to control it |
|---|---|---|
| Active soil pressure | 60 to 75 percent | Correct soil parameters, drained or undrained choice |
| Hydrostatic pressure | 10 to 30 percent | Weep holes, drainage, sealed interlocks |
| Surface surcharge | 5 to 15 percent | Setback rules for cranes and stockpiles |
| Seismic or impact | Case by case | Pseudo-static check for high-risk sites |
How Do You Calculate the Required Tieback Load Step by Step?
The math is not hard, but the order matters. Follow the same sequence every time and you will not miss a load case.
You calculate the required tieback load in four steps: compute the active pressure coefficient, integrate the lateral pressure over the wall height, balance the moments to find the anchor force per meter of wall, then multiply by spacing and correct for the anchor angle. A safety factor on the passive resistance keeps the result conservative.
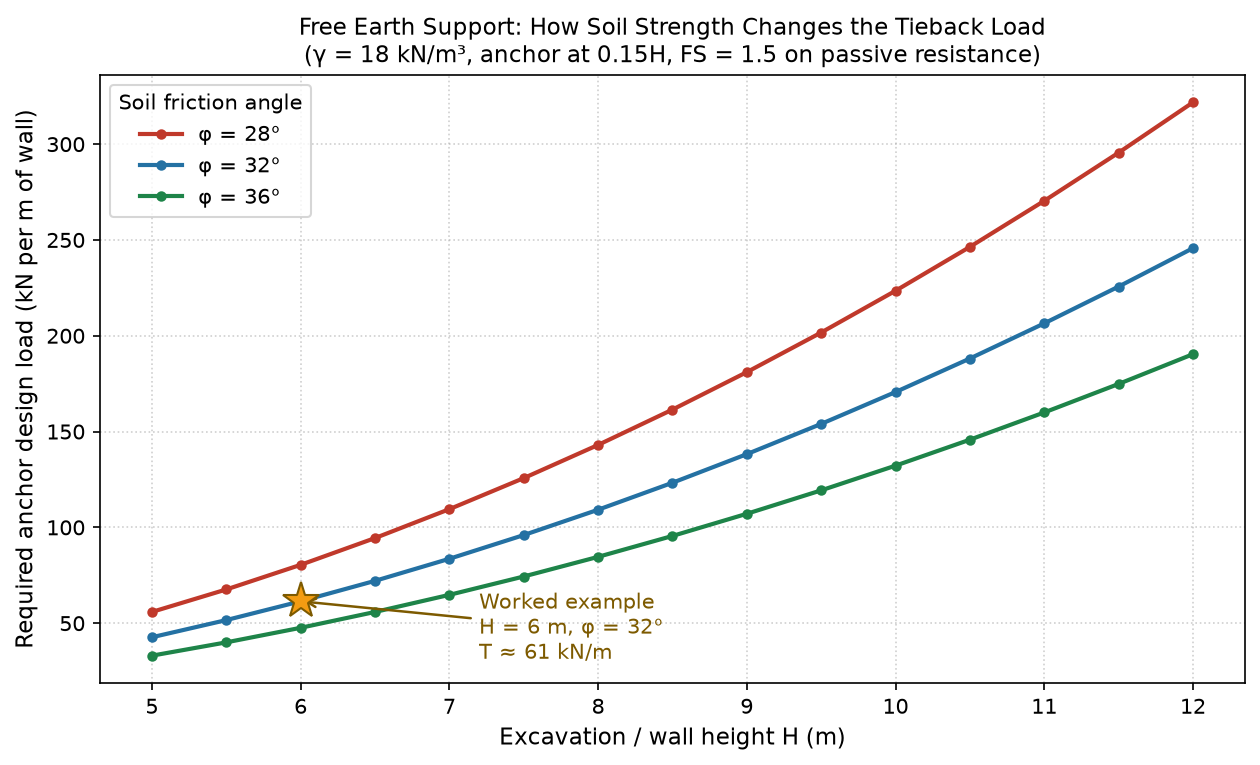
A worked example from one of my projects
Here is the case behind the marked star in the chart. A 6 meter excavation in medium dense sand, unit weight 18 kN/m³, friction angle 32 degrees, anchor set at 0.15H with a 30 degree inclination. First, the active coefficient: Ka = tan²(45 − 32/2) = tan²(29°) ≈ 0.31. Second, the total active thrust: Pa = 0.5 × 18 × 6² × 0.31 ≈ 100 kN per meter of wall. Third, the toe resistance: with a factor of safety of 1.5 applied to the passive wedge, the embedment can be credited with about 39 kN per meter. Fourth, the design tieback load is the remainder: roughly 61 kN per meter of wall. At 2.4 meter spacing, one anchor carries about 146 kN horizontally. Correcting for the 30 degree angle gives an axial anchor force of about 169 kN. The chart shows why soil strength matters so much: at 12 meters of excavation, the same wall needs 245 to 320 kN per meter depending on the friction angle. That difference can change the pile section, the rod diameter, and the crane on site. For deeper cases I also run a numerical check, as described in our article on numerical analysis and load calculation for steel sheet piles.
| Step | Input | Result |
|---|---|---|
| 1. Active coefficient | φ = 32° | Ka ≈ 0.31 |
| 2. Active thrust | γ = 18, H = 6 m | Pa ≈ 100 kN/m |
| 3. Toe resistance, FS = 1.5 | Passive wedge | ≈ 39 kN/m credited |
| 4. Design tieback load | Balance | ≈ 61 kN/m of wall |
| 5. Force per anchor | Spacing 2.4 m | ≈ 146 kN horizontal |
| 6. Axial anchor force | θ = 30° | ≈ 169 kN per anchor |
How Do Anchor Spacing and Angle Change the Load per Anchor?
Spacing looks like a free choice on paper. It is not. Every layout decision moves load between the wall, the wale, and the soil mass.
The load per anchor equals the tieback load per meter multiplied by the spacing, divided by the cosine of the anchor angle. Tighter spacing lowers the force per anchor but raises the number of drilling points. Steeper angles increase the axial force and shorten the horizontal distance to the bond zone.

Why steeper is not always safer
A steeper anchor reaches deep, competent soil faster, and that helps when the near-surface ground is weak. But gravity works against you: the axial force grows as the cosine drops, and the vertical component of the anchor load adds downward drag on the wall and the wale. On one warehouse pit, the contractor wanted 45 degree anchors to clear an adjacent foundation. The axial force jumped more than 40 percent compared with a 20 degree layout, and the wale section had to grow one size. We settled on 25 degrees with a slightly longer free length. The lesson I pass on to buyers is this: fix the angle from the ground profile first, then adjust spacing to match the wale and rod capacities. If you change spacing after the rods are ordered, the threads and lock nuts may no longer match the new load. Anchor hardware is cheap to change on the drawing and expensive to change on site. Our overview of structural strength and load-bearing capacity of steel sheet piles covers how the wall side of this trade-off works.
| Spacing at T = 61 kN/m | Horizontal force per anchor | Axial force at 25° | Axial force at 30° |
|---|---|---|---|
| 1.8 m | ≈ 110 kN | ≈ 121 kN | ≈ 127 kN |
| 2.4 m | ≈ 146 kN | ≈ 161 kN | ≈ 169 kN |
| 3.0 m | ≈ 183 kN | ≈ 202 kN | ≈ 211 kN |
| 3.6 m | ≈ 220 kN | ≈ 243 kN | ≈ 254 kN |
How Do You Verify Tieback Capacity Before Excavation?
A calculation is a promise. Testing is the proof. No anchor should see full wall load until it has passed a test of its own.
You verify tieback capacity with a suitability test on the first anchors and proof tests on a fixed percentage of production anchors. Each test loads the anchor in stages, measures movement against load, and compares the result with acceptance limits. If an anchor fails, the bond length is extended or a replacement is installed.
Proof testing acceptance rules I ask for
Standard practice on my projects is simple. Suitability anchors get a staged test up to 1.5 times the design load, with creep measured over several hold periods. Production anchors get a proof test at 1.25 to 1.5 times design load, and a sample of 5 to 10 percent, whichever gives more anchors on the wall. Movement during the final hold must fall below the acceptance limit in the specification, and the total movement must recover mostly on unload. The grout for the bond zone deserves the same respect; you can read how grouting forms the load-bearing body of the anchor. I also ask the site team to log the actual drilling depth and the soil returned with each anchor. When the log matches the design soil profile, the calculated tieback load means something. When it does not, we recalculate before the retaining wall is loaded. This habit has saved two of my customers from re-drilling a full wall. For related reading, see our design considerations for steel sheet pile retaining walls and our guide on selecting sheet piles based on soil conditions.
| Test type | Purpose | Typical acceptance basis |
|---|---|---|
| Suitability test | Confirm bond capacity in the real soil | Creep below limit at 1.5 × design load |
| Proof test | Check each sampled production anchor | Movement within limit at 1.25–1.5 × design load |
| Movement monitoring | Watch wall behavior during excavation | Deflection and rod strain below alert levels |
| Documentation | Keep the load path traceable | Signed logs, grout records, MTC for rods |
My Take on Tieback Loads
I sell sheet piles, so you might expect me to push the biggest section on every project. I do the opposite when the wall is anchored. A correct tieback calculation often lets a Z-type section replace a heavier one, and the savings on steel usually outweigh the anchor cost by a wide margin; our dimensions, thickness, and section modulus guide shows the numbers behind that choice. But I never let anyone shave the safety factor on the passive resistance to win a quote. The ground does not read quotations. When a customer sends me wall height and soil data, my first question is always about the water table, because that single number moves the anchor load more than any other input. Give me honest data, and I will give you a wall that stands.
Conclusion
Calculate the tieback load from honest soil and water data, size the anchor for spacing and angle, and prove it with staged tests. Do these three things and your anchored wall will hold.